


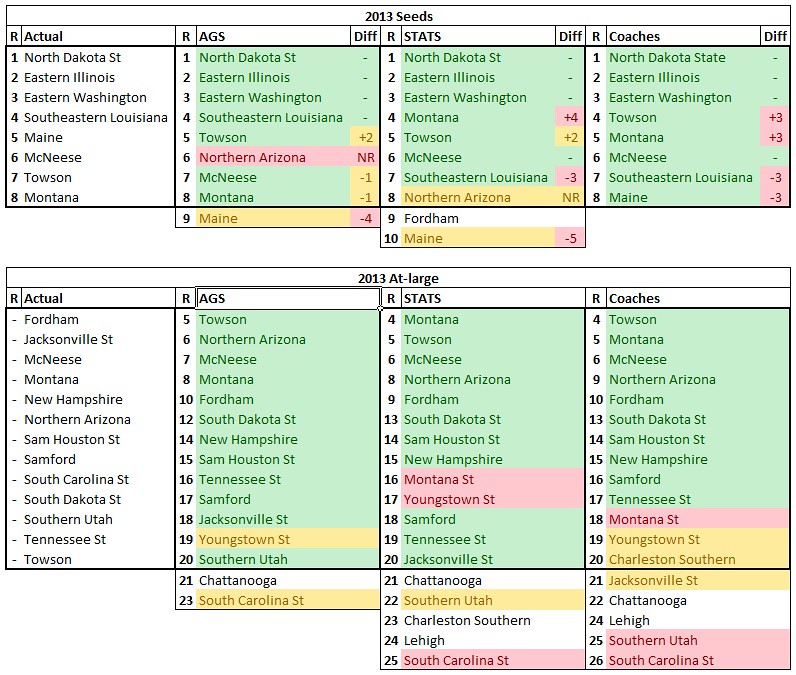
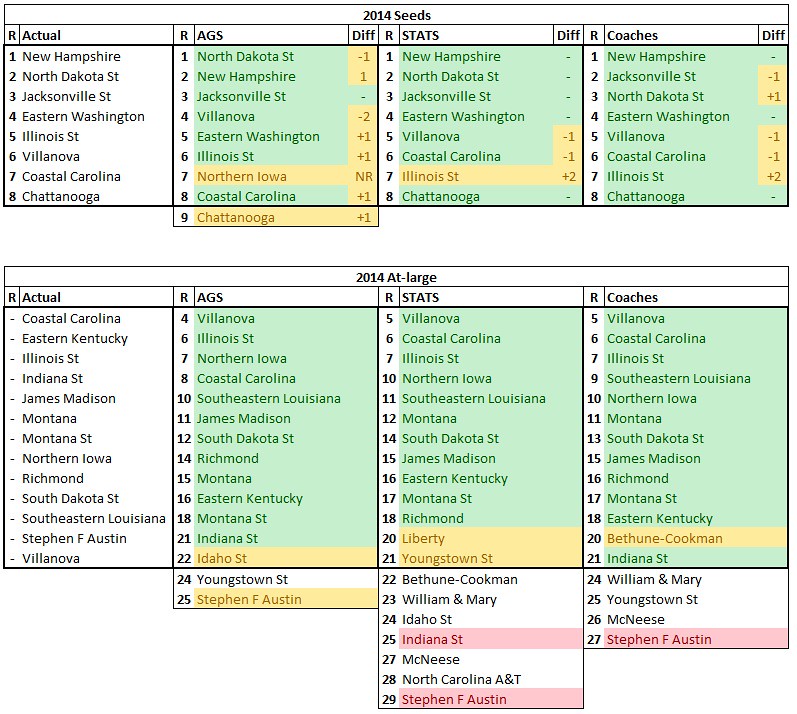
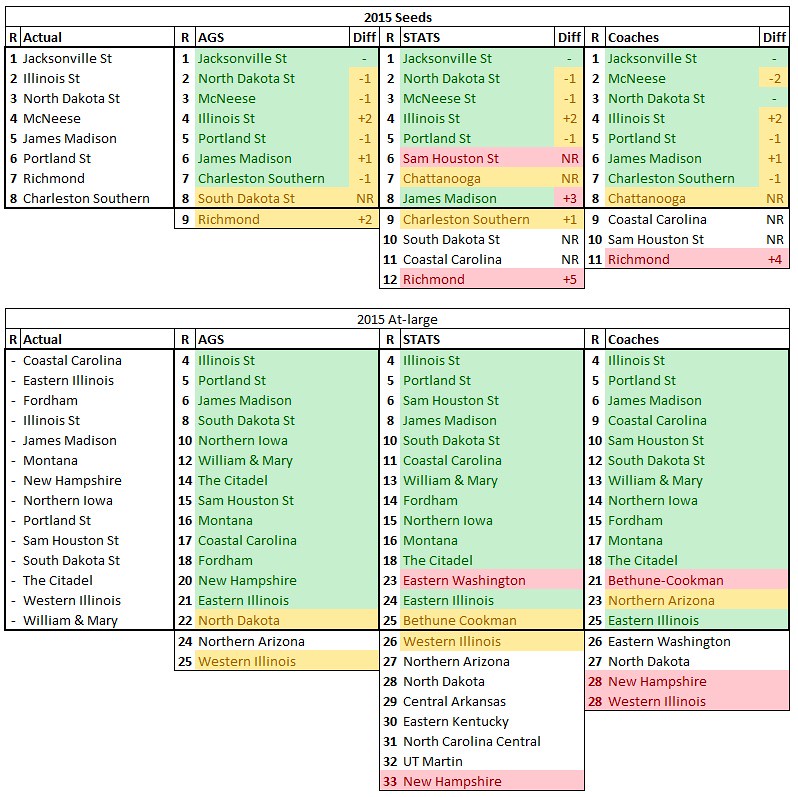
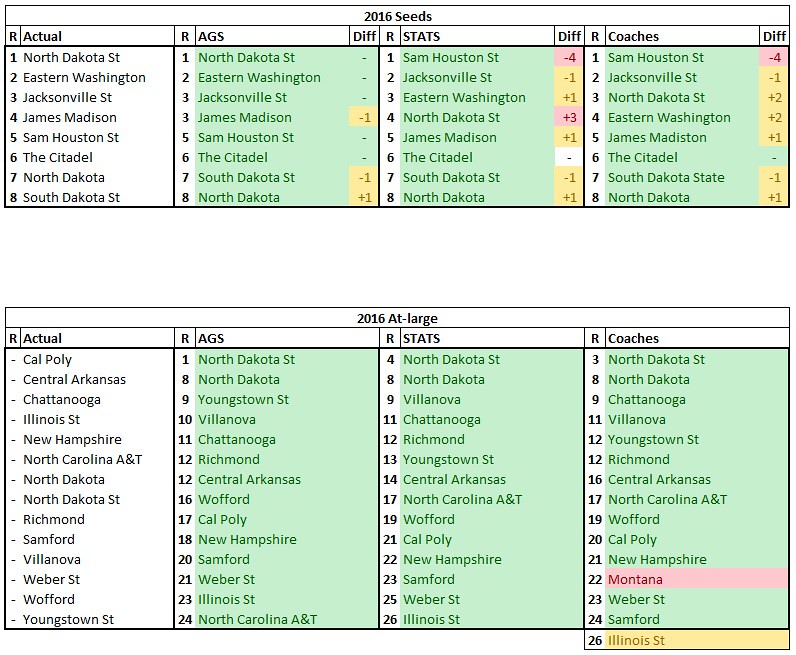
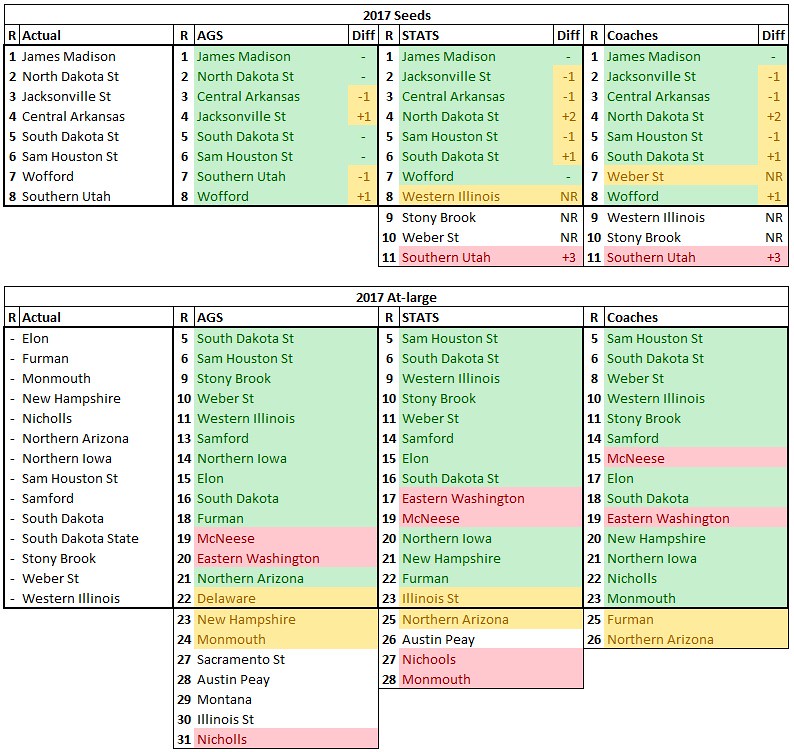
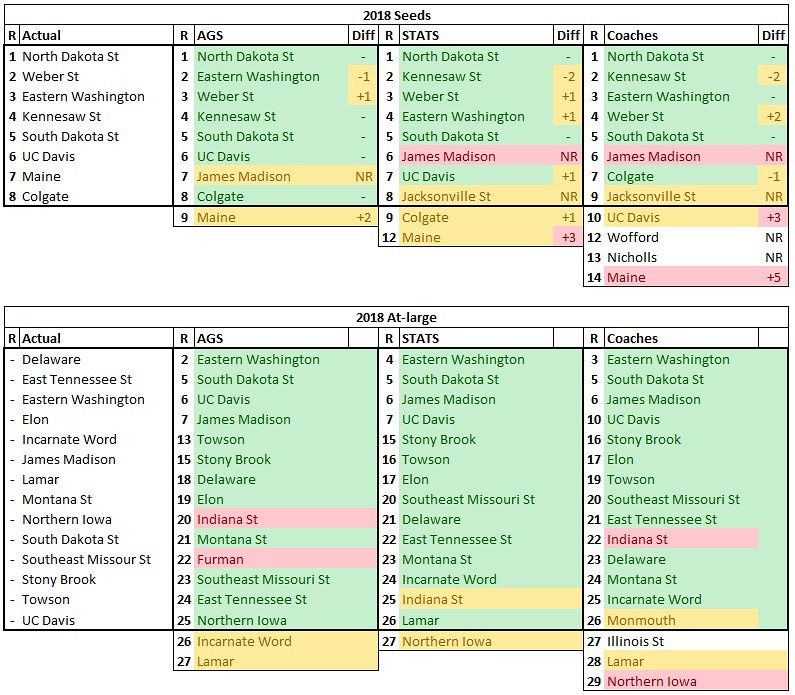
So there was a discussion about this in the STATS poll thread this week so I went back to 2013 (when the field expanded to 24 teams and 8 seeds) to compare the final regular AGS polls with the final regular season STATS and Coaches polls to put some data behind which poll reflects the selection committee's decisions the best. I color coded green for a perfect projection, yellow for a projection that was either 1 or 2 spots off, and red for a projection that was 3 or more spots off.
Here's the data:
Here's the summary of it all. The "bad misses" part refers to any projection that was 3 or more spots off:
There you have it. Digest. Discuss. Debate.


 Reply With Quote
Bookmarks